The Real Cost of Architecture Debt (And How to Actually Measure It)
Architecture debt doesn't show up on a balance sheet, but it shows up everywhere else: slower releases, bigger incidents, harder hiring. Here's a framework for measuring it before it measures you.

Every engineering leader has a rough sense that their system has gotten "harder to work in" over time. Fewer can say by how much, in which parts of the system, or what it's actually costing the business. That gap between "we know it's bad" and "we can show you where and how bad" is where most architecture conversations stall out.
Technical debt has a well-known metaphor problem: it implies a single number, like a loan balance, when in practice it's a portfolio of unrelated risks accumulating in different parts of a system at different rates. Architecture debt is the subset of that portfolio that compounds the hardest, because it lives in the boundaries between things, not inside any one thing.
Why Architecture Debt Is Different From Code Debt
A messy function is expensive to read. A missing test is expensive to change with confidence. Both are real, both are local, and both are fixable in an afternoon by whoever touches that file next.
Architecture debt doesn't work that way. It lives in the decisions that determine how far a change has to travel before it's safe to ship: how tightly services are coupled, whether a schema change in one place breaks three others, whether a deploy of one component requires coordinating five teams. Nobody "owns" that debt the way they own a file, which is exactly why it never makes it onto a sprint board.
The tell: code debt shows up as a task in a backlog. Architecture debt shows up as a pattern across your incident log, your onboarding time, and your last three roadmap slips, and almost nobody connects those three things to the same root cause.
The Eight Places Architecture Debt Actually Hides
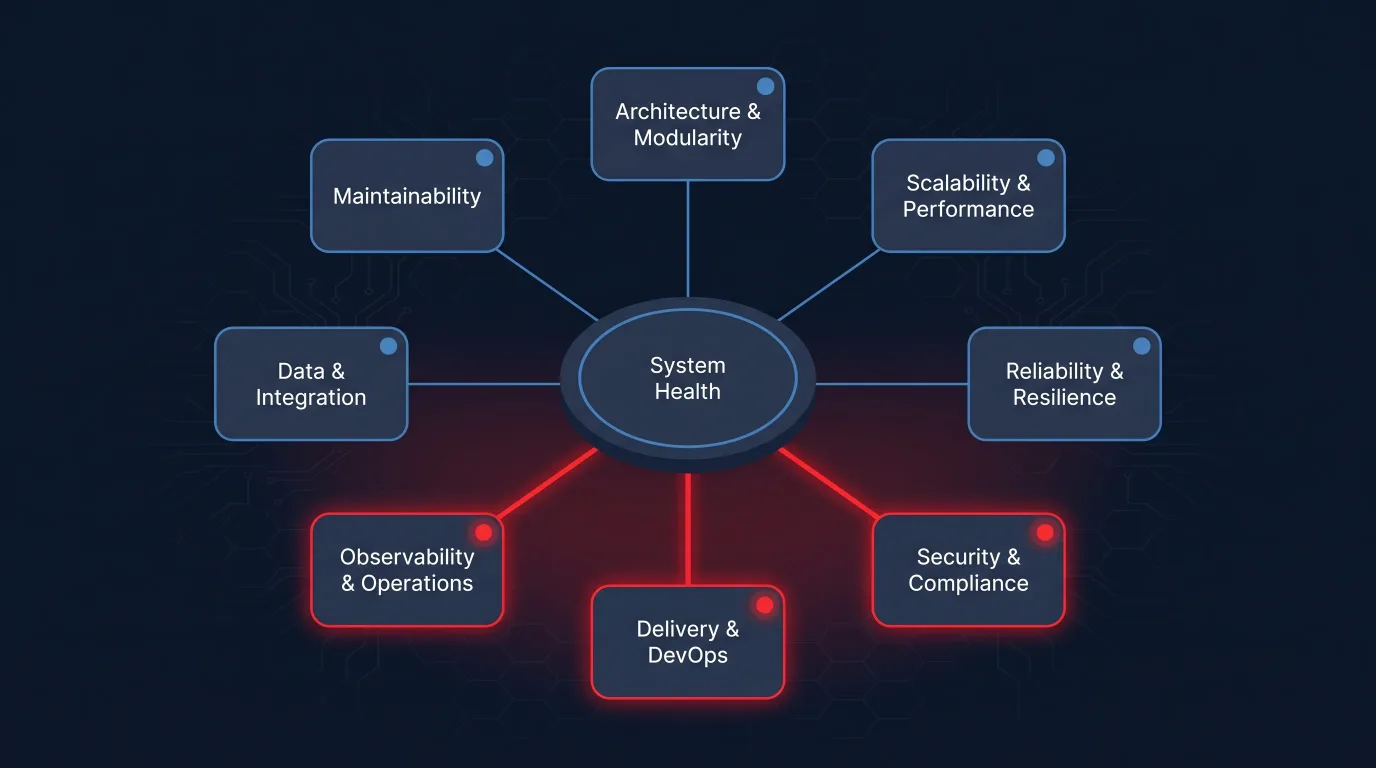
After enough of these engagements, the debt reliably clusters into the same eight dimensions, regardless of stack or industry:
| Dimension | What it's really asking | What it costs when it's bad |
|---|---|---|
| Architecture & Modularity | Do boundaries isolate change, or does everything ripple? | Engineering velocity |
| Scalability & Performance | Does growth cost linear effort, or does it require heroics? | Growth economics |
| Reliability & Resilience | Do failures stay contained, or do they cascade to customers? | Customer impact |
| Security & Compliance | Are identity, secrets, and data controls sound, or assumed? | Risk exposure |
| Delivery & DevOps | Does shipping take minutes, or does it take a ceremony? | Time to market |
| Observability & Operations | Can you find root cause in minutes, or is it always a hunt? | Time to resolution |
| Data & Integration Architecture | Can one system change without coordinating five others? | Independent change |
| Maintainability & Modernization | Can the next hire be productive in weeks, or months? | Strategic flexibility |
Most teams can name their worst dimension in about thirty seconds when asked directly. What they usually can't do is rank all eight against each other, which matters, because the fix for a Delivery problem and the fix for a Security problem compete for the same engineering time and rarely get prioritized against a common scale.
What It Actually Costs, In Terms a CFO Will Sit Still For
"Architecture debt" doesn't move a budget conversation. These four numbers do:
- Deployment lead time. The gap between "code is done" and "code is live." High-debt systems routinely run 5-10x slower here than well-bounded ones, and every day in that gap is a day of engineering payroll spent waiting instead of building.
- Change failure rate. What percentage of deployments cause an incident or require a rollback. This is the single clearest signal of coupling debt, because tightly coupled systems can't isolate the blast radius of a change.
- Mean time to resolution. How long a production incident stays open. Weak observability doesn't cause more incidents, it just makes each one cost more, in engineering hours and in customer trust, than it needed to.
- Time to first meaningful commit. How long a new senior hire takes to ship something real. This is the number that quietly caps how fast you can grow the team, because a system nobody can safely change is a system nobody wants to stay on.
None of these are opinions. They're all measurable from data you already have: your deploy logs, your incident tracker, your onboarding records.
Why "We'll Refactor It Eventually" Doesn't Work
Architecture debt compounds, and it compounds in a specific, predictable direction: every new feature built on a weak boundary makes that boundary more expensive to fix later, because there's now more code depending on the shortcut. A tangled integration that would have cost two weeks to fix a year ago costs two months today, not because the code got worse, but because more of the business now depends on it staying exactly as tangled as it is.
This is why "we'll clean it up after this release" is almost never true. There's no release after which the debt is smaller. There's only a release after which fixing it is more expensive than it was before.
The way out isn't a rewrite. It's ranking: knowing which of the eight dimensions is your actual constraint right now, fixing that one first, and re-measuring before committing to the next. Most systems don't need to be good at all eight dimensions. They need to stop being critically weak in the one or two that are actually setting the pace for everything else.
A 20-Minute Starting Point
We built the Architecture Debt Index specifically because "how bad is it, really" shouldn't require a six-week engagement to answer directionally. It's a free, 32-question self-assessment across all eight dimensions above, and it takes about 20 minutes. You get a score, a risk tier, and a ranked list of which dimension is your actual primary constraint, not a vague "your architecture needs work" but a specific, prioritized answer.
Key takeaways:
- Architecture debt lives in boundaries, not files, which is why it never lands on a normal backlog.
- It clusters into eight measurable dimensions, and most teams are only critically weak in one or two of them.
- Deployment lead time, change failure rate, MTTR, and time-to-first-commit turn "it feels slow" into numbers a budget conversation can use.
- Debt compounds in one direction: every day you wait, the eventual fix gets more expensive, not less.
If you want a specific, ranked answer instead of a general sense of unease, take the Architecture Debt Index assessment or book a discovery session to walk through your results with a principal architect.
Keep reading
All articles
What to Automate, What to Skip: A Testing Strategy for Fast-Moving Teams

Taming the Kraken: A Complete Guide to Managing Technical Debt in Software Projects

Microservices vs. Monoliths: A Complete Guide to Making the Right Architectural Choice in 2024
Get new articles by email.
One or two a month. No marketing, no forwarding your address. Unsubscribe anytime.